Turnitin Similarity Colors: What the Bands Mean

Turnitin colours the Similarity column in bands, not grades. Blue marks a report with no matches, green covers 1–24%, yellow 25–49%, orange 50–74% and red 75–100%. Each band shows how much text matched, not whether the matching is a problem.
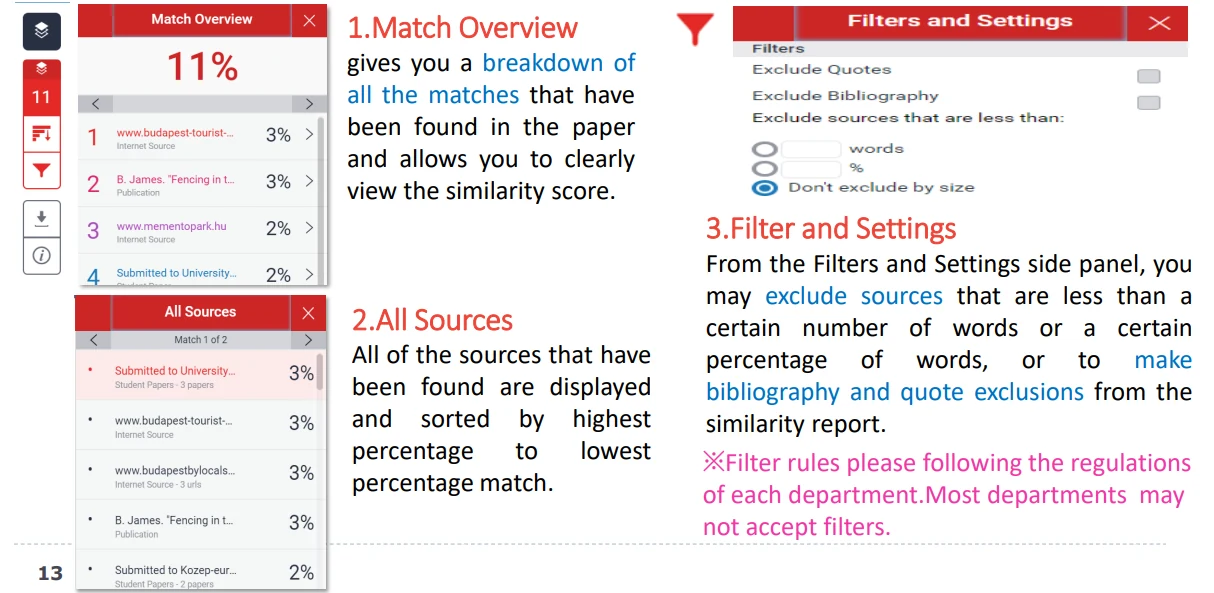
The five bands
The colour changes when the percentage crosses a boundary. A 24% paper and a 26% paper can look like different verdicts while their matches are nearly identical.
Turnitin states there is no acceptable or perfect score. Institutions set their own limits, and many set them inside the green band.
The colours exist so a tutor can scan a stack of reports quickly. Each one is generated from the percentage and carries no separate meaning.
Blue and green
Blue means the report found no matching text. Green means a small share matched: a few phrases, a standard definition, a block of references.
A green number can still hide a copied paragraph from a key source, and that weighs the same as twenty paraphrased definitions. Open the source list before you relax.
A blue report does not prove the work is original either. It means the search found nothing, which is a narrower claim.
Yellow and orange
Yellow and orange mean a quarter to three quarters of the file matched something. Tutors tend to read these reports line by line.
The number alone cannot tell you whether to worry. A literature review built on one framework can sit at 40% with every quotation properly cited.
What separates a clean report from a risky one is the split between cited and uncited matches. The Match Groups panel shows that split.
A 25% match held by one article deserves a close read. The same 25% spread across fifteen entries usually means shared terminology.
Red
Red starts at 75% and usually means most of the document exists elsewhere already. Reused files, shared templates and earlier submissions are the common causes.
Red is a prompt to check, not a sentence. Our notes on why a similarity score reaches 100% cover the full-file cases.
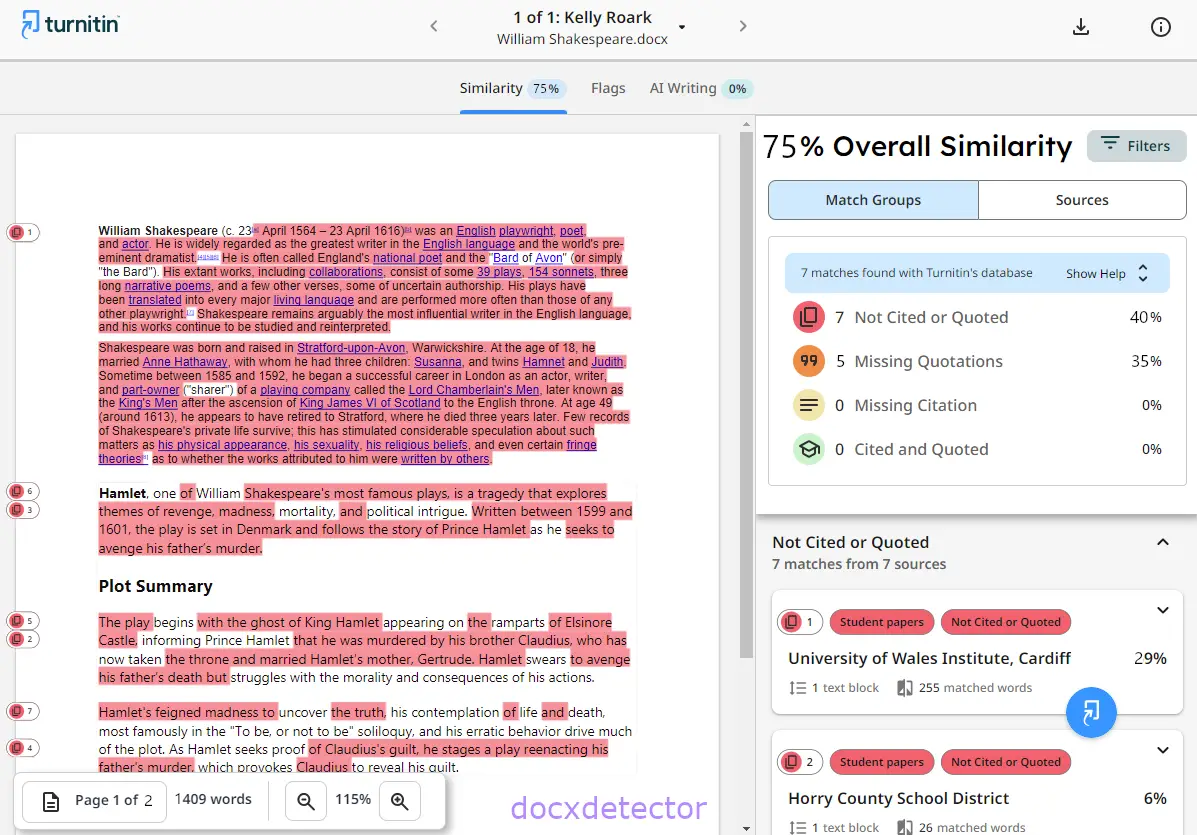
Using the band in practice
Treat the colour as a triage tool. It tells you how much of the report needs reading, not what the reading will find.
- Open the source list before you react to the colour.
- Compare the percentage with the number of sources behind it.
- Check the filters, then read the AI score on its own page.
If the band and the source list tell different stories, trust the source list.
Two reports in the same band can need opposite responses, which is why the sources carry more weight than the colour.
What the colour leaves out
The colour follows the percentage after your instructor's filters are applied. Excluding quotes and the bibliography can drop a report by a band or two, and many departments will not accept that filtered figure.
It says nothing about the AI score either. Turnitin measures AI writing separately and independently, so a green report can carry a high AI percentage.
Turnitin's guidance says the percentage should be read next to the matches. The colour is a shortcut for that reading, not a replacement.
Turnitin's own similarity score guidance makes the same point: the percentage is a starting point for reading, not a grade.
The steps in how to read a Turnitin similarity report show what to open first, and what a good score depends on explains the judgement call.
FAQ
Is a red report an automatic fail?
No. Turnitin says a high score does not by itself mean plagiarism, and your institution decides the outcome. Red usually means the file or its sources need a closer look.
Is green a safe score?
Not always. Green is a low percentage, but one uncited paragraph from an important source can matter more than a page of cited definitions.
Can the colour change between two reports of the same work?
Yes. The band follows the percentage, and the percentage moves when filters change or when new sources reach the database. Compare reports made with the same settings.
Check your paper before you submit — you get a similarity score and an AI score in one report.